DrJava Primer
Welcome to UPenn's DrJava primer. This guide is intended to get you used to the basics of using the DrJava IDE (Integrated Development Environment).
1. Running DrJava and Setting Preferences
First, make sure you have properly installed DrJava (and the DJK). If
you need to install one or both, and/or if you need to show DrJava where to
find tools.jar, see these instructions.

Once it's installed, DrJava appears as a big J icon (right) and you should be able to open it like any other application. In the labs, the DrJava icon may be on the desktop, or under the SEAS menu or programming menu.
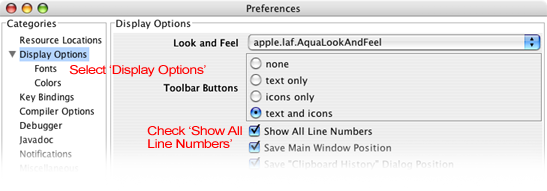
We highly suggest that you "turn on line numbers"; this makes debugging much easier. Select Edit > Preferences, click on Display Options at left, and check Show All Line Numbers. We suggest that you do this on both a lab computer as well as on your home computer (if you have one).
2. Anatomy of the IDE
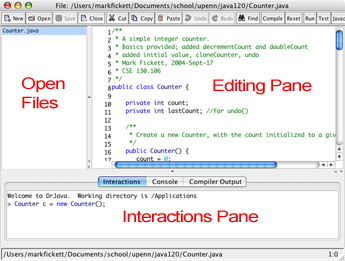
The DrJava window is divided into three panes:
- Top right: the Editing pane (or "Definitions Pane"), where you will create and edit Java classes.
- Top left: list of Open Files
- The bottom has 3 tabs: the Interactions Pane, where you can interactively type code and get feedback. We will start working here. The other tabs are for Compiler Output (where bugs in the code are reported ) and the Console (which shows text output of a program).

The toolbar at the top of the window contains standard editing buttons (opening, closing, saving files; copy, paste, undo; find), as well as Java-specific functions. Of the Java-specific ones, you'll mostly be using Compile — to compile your source code into bytecode — and reset — to reset the interactions pane so you have a clean slate for exercising your program.
Commands from the toolbar are also available under the application menus, along with many other commands; text editing is under the Edit menu, and compile and reset are under Tools.
3. Getting Started with the Interactions Pane
It's easiest to learn DrJava by experimenting with the Interactions Pane. DrJava displays a prompt which is the '>' character. You as the user will type in some information and hit ENTER or RETURN. DrJava will attempt to evaluate the Java code you type in. In some cases DrJava will display a response. If the code you type is invalid, DrJava will display an error message. Notice in the the interactions below that if the user types in an arithmetic or logical (true/false) expression, DrJava displays its value. Try the interactions shown below.
Sample Interactions (evaluating expressions)
Welcome to DrJava.
> 1+1
2
> 5*2+1
11
> 5*(2+1)
15
> (true || false) && true
true
> 5.0/2.0 == 2.5
true
Sample Interactions (executing variable declaration statements and assignment statements)
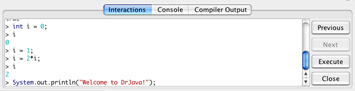
Java has variables (for example: x, y, and z). A Java variable is created with a variable declaration statement (e.g. int x;). It is given a value with an assignment statement (e.g. x = 1;). The last interaction below shows that a variable (in this case, y) can be declared and assigned a value in one statement.
  Welcome to DrJava.
> int x;
> x
0
> x = 1;
> x = 2 * x;
> x
2
> int y = 5;
Variables you create will remain defined until you quit and re-open DrJava or RESET the interactions pane with the RESET button on the toolbar (or when compiling with automatically resets the interactions).
For command input, note that:
- Pressing the up arrow gets you the command you last typed. (THIS SAVES A LOT OF TIME!!!)
- Left- or Right-arrowing past the end of a line takes you to the other end.
- You can only edit the bottom-most (current) line, although you can copy from past lines.
History Files
It is frequently useful to save your interactions in a file so you (or someone else) can run them again without having to type them all in again. To try running such a history file, download sampleinteraction.hist , select Tools > Load Interactions History as Script, and select the history file. Once loaded, you can click Next to get the next command from the script, and then either click Execute or hit enter/return to execute it.
4. Creating Classes and Objects
Creating Classes and .java Source Files
To create a brand new class in DrJava, simply type code in to the Editing Pane. To save the code in a file, click the SAVE button. DrJava will prompt you for a file name and suggest the same name as the class, which you should accept. (Java has a rule that a class called X should be stored in a file called X.java. DrJava will append ".java" on to the end of the file name.) Before accepting, you can browse to find/create a folder to store the file in.
To open an existing file, select File->Open. You should only open a .java file (which contains Java source code), not other files such as .class files (which contain compiled bytecode for a class), .jar files (which potentially contain bytecode for multiple classes), image files, or any other type of files.
To start working on a new file, select File > New.
DrJava has syntax hilighting to make it easier to read code; it also auto-indents as you type or if you select a section of code and hit tab.
While editing, useful commands are:
- Safe, save all — you can save the current file with the save button, or select File > Save All to save all open files.
- Revert to saved — undo all changes since you last saved the current file.
- Close — closes the (one) current file, selected in the 'open files' pane.
- Compile, compile all — to run your code in the interactions pane, you first need to compile it (with requires saving any changes). You can either compile only the current file with the toolbar button, or compile all from the Tools menu.
Creating Objects in the Interactions Pane (Example: Counters)
By using the interactions pane, you can create and use objects without needing a main method — that is, without writing a full-blown Java application. This is great for quickly and easily testing your classes!
Here's an example with a simple Counter object (Counter.java). Assuming you have typed the Counter class in to the main frame and compiled it. You can now created instances of the Counter in the interactions pane
Welcome to DrJava.
> Counter c = new Counter();
> c.getCount()
0
> c.incrementCount()
1
> c.incrementCount();
> c.incrementCount();
> c.getCount()
3
> c.reset();
> c.getCount()
0
5. Debugging
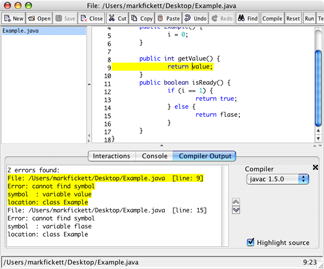
Compiler errors: The first level of debugging is getting your code to compile. (Often the compiler won't find some errors until you've fixed others.) Compiler errors appear in the Compiler Output tab of the bottom pane, and are hilighted in the source code. (The line number is also given.) Syntax hilighting also helps with catching syntax errors — for example, the reserved word false is turned blue, but the typo fasle is not, since DrJava doesn't recognize it. When compilation is successful, DrJava displays "Compilation completed."
Runtime errors: When running your code from the interactions pane, standard Java errors are displayed. For example, you're likely at some point to see a NullPointerException:
> Example e = new Example();
> e.getString()
NullPointerException:
  at Example.getString(Example.java:21)
  at sun.reflect.NativeMethodAccessorImpl.invoke0(Native Method)
  at sun.reflect.NativeMethodAccessorImpl.invoke
	(NativeMethodAccessorImpl.java:39)
  at sun.reflect.DelegatingMethodAccessorImpl.invoke
	(DelegatingMethodAccessorImpl.java:25)
  at java.lang.reflect.Method.invoke(Method.java:585)
Usually, the first line of the Exception's stack trace (bolded here) tells you the line number in your code that generated the problem, from where you can start debugging. (In this case, it was line 21 of Example.java, in the getString method.
Logic errors: Lastly, your code may appear to compile and run fine, but produce bad results due to mis-programming. To combat this, it's best to test each method rigorously to be sure it's doing exactly what you want and expect.
In tracking down logic errors, you may want to use DrJava's debug mode, available through Debugger > Debug Mode, which lets you watch what your code is doing as it runs.