In order to demonstrate the algorithm we conducted the following tests on
various test data. Table 1 gives a short summary of the different tests.
In the following experiments for vector quantization
we used ![]() prototypes, for segment length
prototypes, for segment length ![]() and
and ![]() is
defined as
is
defined as ![]() where
where ![]() is the biggest value in
is the biggest value in ![]() .
.
|
The first testset is a video shot in a dinning room of a hospital.
After removing the motionless frames, we still had ![]() frames. We tested our embedding algorithm to see if it provides
a good separation between different events. We observed that the
unusual activities are embedded far from the usual ones, as can be seen
in figure 7.
frames. We tested our embedding algorithm to see if it provides
a good separation between different events. We observed that the
unusual activities are embedded far from the usual ones, as can be seen
in figure 7.
|
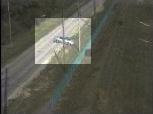
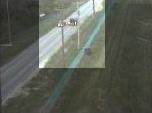
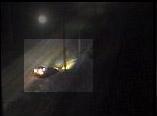
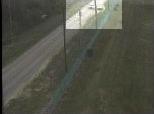
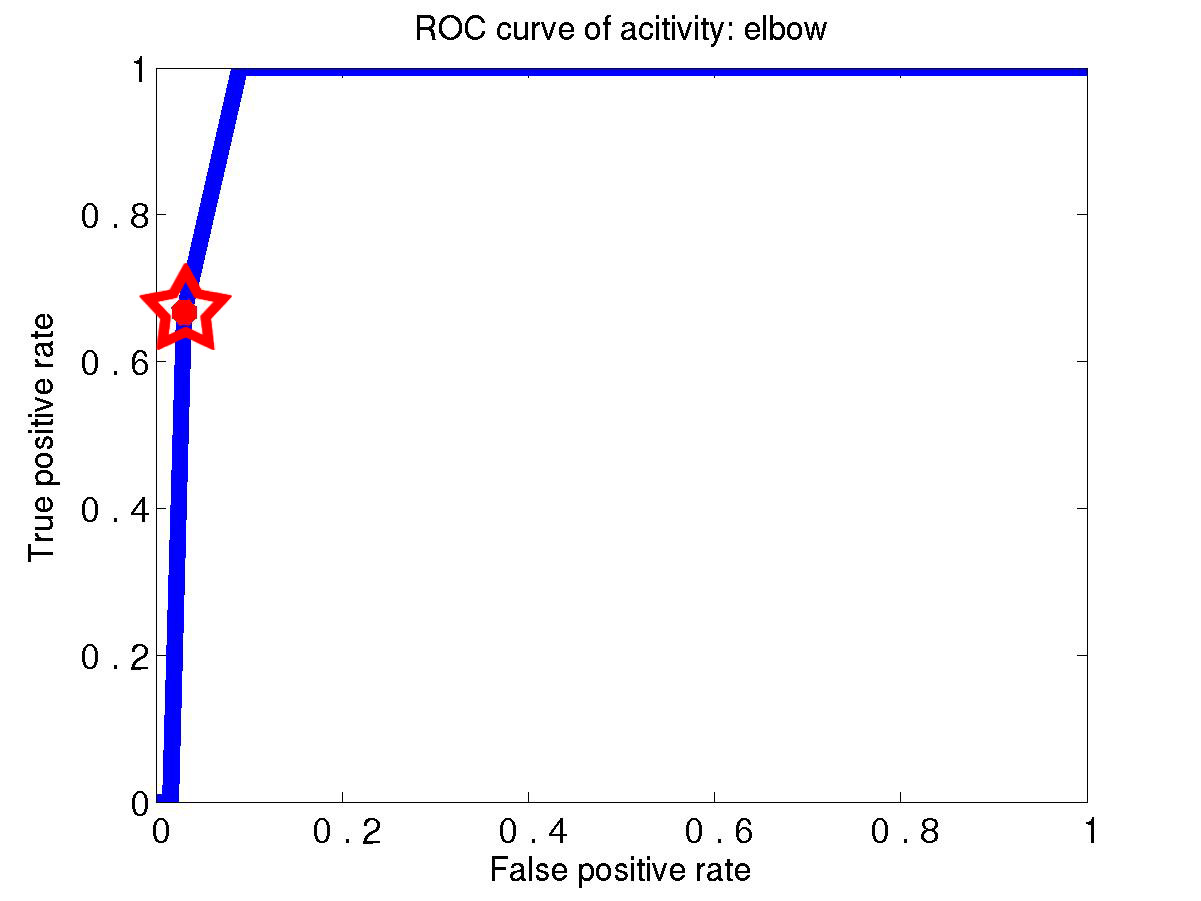
To quantify the ``goodness'' of the embedding provided in our previous
experiment we used another video from a surveillance camera overlooking a
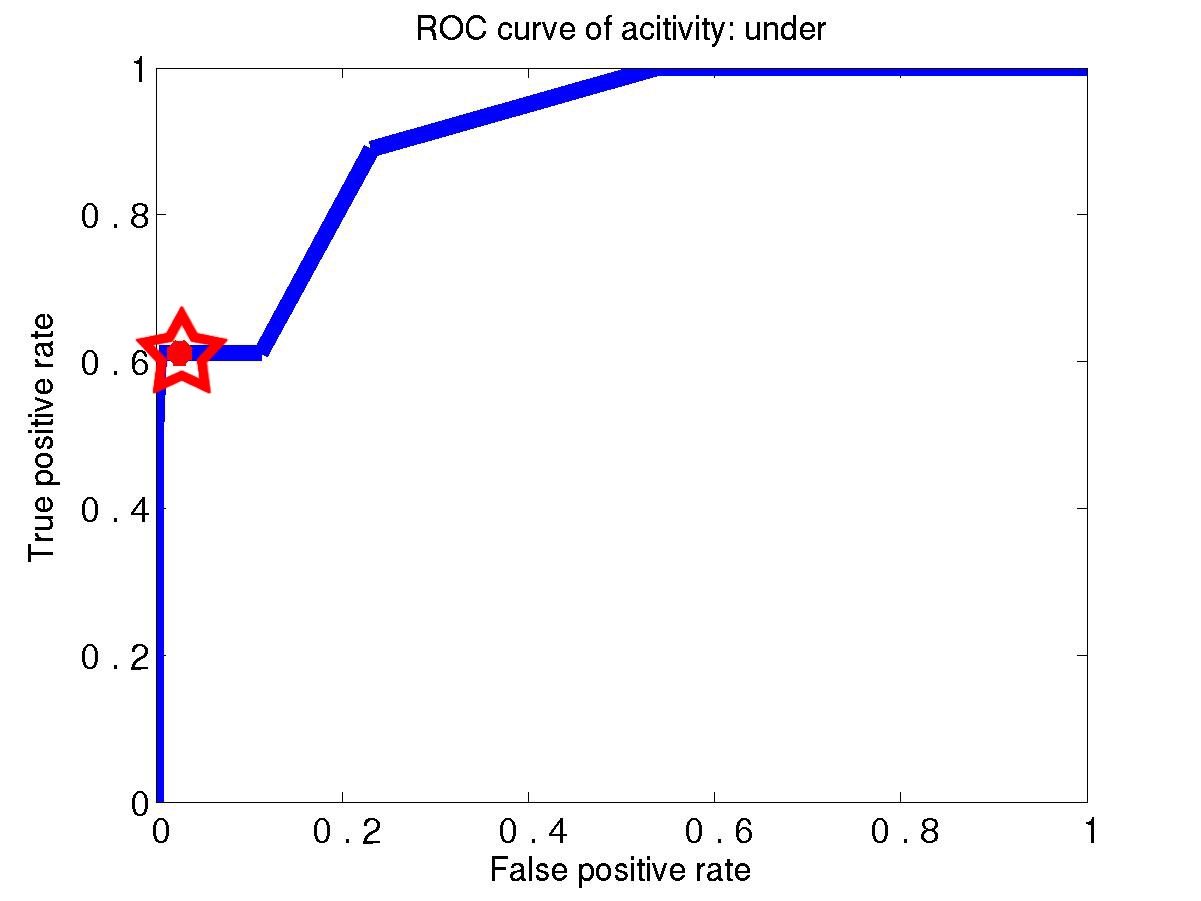
road adjacent to a fenced facility. We have tested our system on a
continuous video from 16:32pm till 12:22pm the next day, containing both
day time and night time videos (in total ![]() image frames).
We applied our embedding algorithm and classified the embedded segments
into two groups, i.e. usual and unusual. To measure the performance we
hand-labeled all the sequences (which contained motion) if they were
unusual or not and compared our results to the ground truth. The
promising results of this experiment are shown in figure 8.
Though, this surveillance sequence is somewhat limited in the type
of actions it contains (particularly it has just
image frames).
We applied our embedding algorithm and classified the embedded segments
into two groups, i.e. usual and unusual. To measure the performance we
hand-labeled all the sequences (which contained motion) if they were
unusual or not and compared our results to the ground truth. The
promising results of this experiment are shown in figure 8.
Though, this surveillance sequence is somewhat limited in the type
of actions it contains (particularly it has just ![]() unusual sequences), we
would like to point out that even without motion
features, i.e. only with spatial histograms, we were able to detect events
such as cars making U-turns, backing off, and people walking on and off
the road.
unusual sequences), we
would like to point out that even without motion
features, i.e. only with spatial histograms, we were able to detect events
such as cars making U-turns, backing off, and people walking on and off
the road.
|
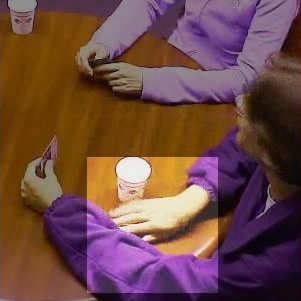
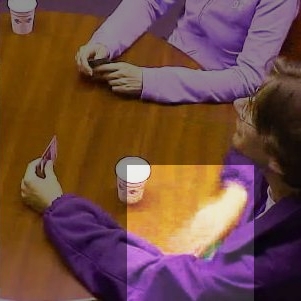
Next experiment was aimed to measure the performance
in a more complex setting: we recorded a ![]() minutes long poker game
sequence, where two players were asked to creatively cheat.
The video contains
minutes long poker game
sequence, where two players were asked to creatively cheat.
The video contains ![]() frames, and every
frames, and every ![]() second hand-labelled
with one of the
second hand-labelled
with one of the ![]() activity labels. There is a wide variety of natural
actions, in addition to playing cards and cheating, players were
drinking water, talking, hand gesturing, scratching. Many of the
cheatings are among detected unusual events. To demonstrate we
can detect a specific cheating type, we find those unusual events
corresponding to a prototype feature chosen by us. The results of
detecting two cheating types are shown in figure 9.
activity labels. There is a wide variety of natural
actions, in addition to playing cards and cheating, players were
drinking water, talking, hand gesturing, scratching. Many of the
cheatings are among detected unusual events. To demonstrate we
can detect a specific cheating type, we find those unusual events
corresponding to a prototype feature chosen by us. The results of
detecting two cheating types are shown in figure 9.
|
To show that the algorithm can be used for categorizing usual events as well
we took 3 hours long
video from Berkeley Sproul Plaza webcam (http://www.berkeley.edu/webcams/sproul.html),
which contained ![]() frames. The embedding of video segments, and event category
representatives are shown in figure 10 (left).
The automatic categorization of events potentially
can allow us to develop a statistical model of activities, in an unsupervised fashion.
frames. The embedding of video segments, and event category
representatives are shown in figure 10 (left).
The automatic categorization of events potentially
can allow us to develop a statistical model of activities, in an unsupervised fashion.
|
![\includegraphics[width = 0.15 \textwidth, height = 0.13 \textwidth]{resultimages/hospital/the0.eps}](img104.png)
![\includegraphics[width = 0.15 \textwidth, height = 0.13 \textwidth]{resultimages/hospital/the2.eps}](img105.png)
![\includegraphics[width = 0.15 \textwidth, height = 0.13 \textwidth]{resultimages/hospital/the3.eps}](img106.png)
![\includegraphics[width = 0.15 \textwidth, height = 0.13 \textwidth]{resultimages/hospital/negthe2.eps}](img107.png)
![\includegraphics[width = 0.25 \textwidth, height = 0.17 \textwidth]{resultimages/embedding/eig3vs4_hospital.eps}](img108.png)
![\includegraphics[width=0.18\textwidth, height = 0.13\textwidth]{bigfigs/PRCroad}](img111.png)
![\includegraphics[width = 0.15\textwidth, height = 0.13\textwidth]{resultimages/elbow/nondet1.eps}](img116.png)
![\includegraphics[width = 0.15\textwidth, height = 0.13\textwidth]{resultimages/elbow/falsepos1.eps}](img117.png)
![\includegraphics[width = 0.15\textwidth, height = 0.13\textwidth]{resultimages/under/A1.eps}](img118.png)
![\includegraphics[width = 0.15\textwidth, height = 0.13\textwidth]{resultimages/under/A2.eps}](img119.png)
![\includegraphics[width = 0.15\textwidth, height = 0.13\textwidth]{resultimages/under/detected1.eps}](img120.png)
![\includegraphics[width = 0.15\textwidth, height = 0.13\textwidth]{resultimages/under/nondet1.eps}](img121.png)
![\includegraphics[width = 0.15 \textwidth,height = 0.13\textwidth]{resultimages/under/falsepos1.eps}](img122.png)
![\includegraphics[width = 0.5 \textwidth, height = 0.30 \textwidth]{resultimages/webcam/embedding_examples_med.eps}](img124.png)
![\includegraphics[width = 0.36 \textwidth, height = 0.28 \textwidth]{resultimages/embedding/transition.eps}](img125.png)