Plot controller
The Profile Plot’s Controller
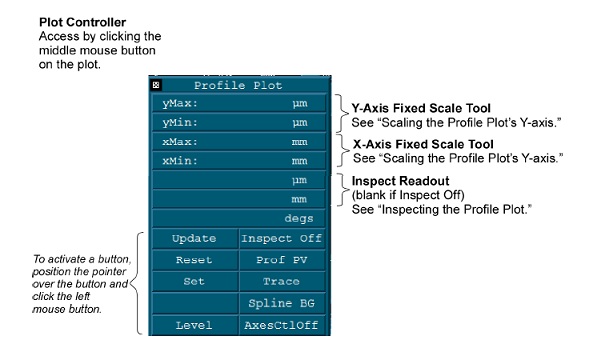
- Update: Redraws the plot to match the current Controller settings.
- Reset: Restores button settings to match the “set” Controller settings.
- Set: Makes the current Controller settings the master or “set” display.
- Level: Works along with inspect feature to temporarily fit and remove the plot area between two crosshairs. The angle of the data (between the Inspectors) must be between ± 45° or ±135° of the X-Axis for Level to operate correctly. The information in this section is applicable to the Autocovariance, Power Spectrum, Histogram, Bearing Ratio, Encircled Energy, and MTF Profile plots.
- Inspect: Turns inspect features on and off. When off, the readouts and the plot crosshairs are non-functional. For other selections see “Inspecting the Profile Plot”.
- PV: Selects automatic scaling of the plot's y-axis. ProfilePV scales the plot to fill the entire area. MapPV scales the plot to the entire data set or Filled plot from which the plot was derived.
- Trace: Selects how data is displayed. Trace displays data as a line graph. Bar displays data as a series of vertical bars. Scatter displays data as points.
- Spline BG: Displays the original slice profile and the filtered slice profile. The Filter control must be set to any setting besides off. The Filter Type control must be set to one of the following: FFT Auto, FFT Fixed, Gaussian Spline Fixed, Gaussian Spline Auto, or Robust Gaussian Spline Fixed. If there are multiple slices, the profile plot displays the currently selected slice in green. The original slice and the filtered slice are in the background and are displayed in gray.
- Axes CtlOff: Selects options for the axes scales; opens a secondary button panel. See “Controlling the Profile Plot’s Axes”.
This discussion covers using the plot Controller for the Profile plot. Most of this information also pertains to the Autocovariance, Power Spectrum, Amplitude Spectrum, Power Spectral Density, Histogram, Bearing Ratio, Encircled Energy, and MTF Profile plots. Some of the plot Controller’s functions are disabled for these other types of two dimensional plots.