Updated on 1/7/2015
1 Start Up
2 Measurement
2.1 Surface Structure and Roughness Measurement
2.2 Step Height Measurement
2.3 Transparent or Semi-transparent Film Measurement
2.4 Stitching Measurement
3 Inspect Data
4 Save/Print Result
4.1 Raw Data
4.2 A Screen Shot
4.3 Process Stats
5 Shut Down
6 Supplemental Documents
1. Log-in on the ISIS scheduler.
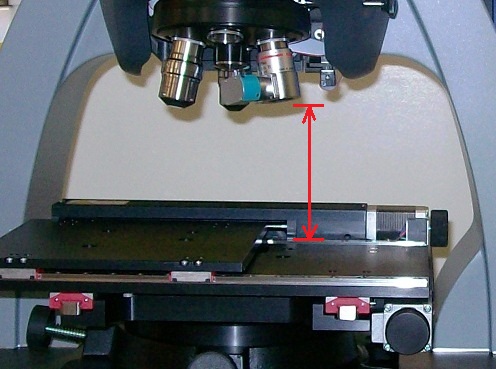
2. Ensure that the objective lenses are NOT close to the sample stage.
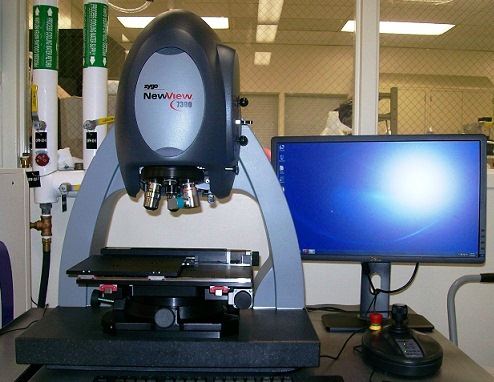
2. Click the "MetroPro" icon on the PC.
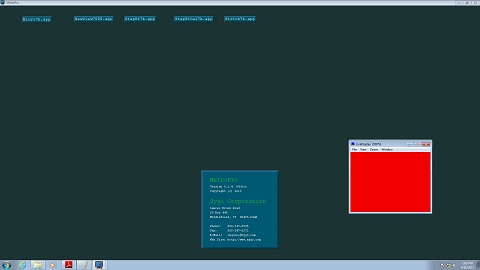
3. The "MetroPro" is opened.
4. If the LED of "Z-stop" button is in red, press it to blink the LED for releasing the stopper.
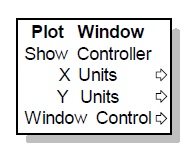
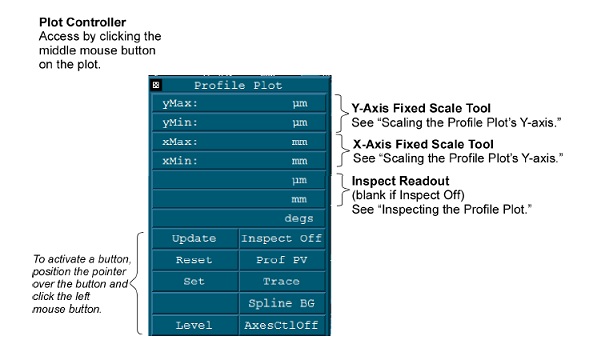
1. Click on the plot with the middle mouse button, or right-click on the plot to open the plot menu window.
- See the detail of Section 7 "Filled Plot and Profile Plot" in Zygo Reference guide.
2. Choose "Show controller" to open the plot controller.
3. Inspect the Data using the plot controller.
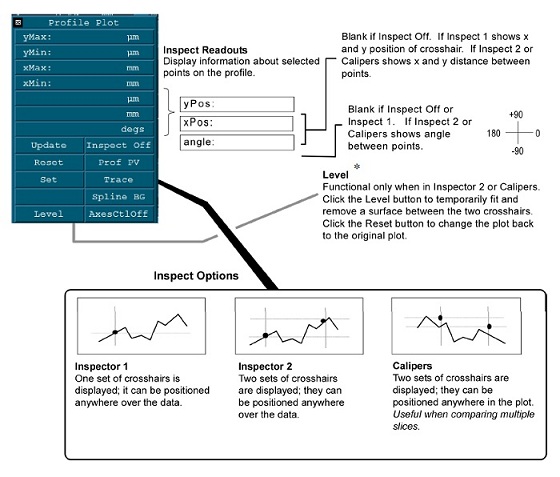
- The inspect feature is used to examine areas of interest in the plot.
- It incorporates three parts of the plot Controller, the Inspect button, the Inspect Readouts, and the Level button.
Note:
- Crosshairs are only displayed when the Controller is open and the Inspect button is on Inspector 1, Inspector 2, or Calipers.
- The angle of the data (between the Inspectors) must be between ±45° or ±135° of the X-Axis for Level to operate correctly.
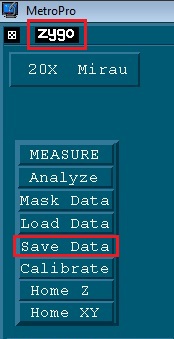
1. Click the "Save Data" button.
2. In the file handler, enter a name for the file ending with “.dat”.
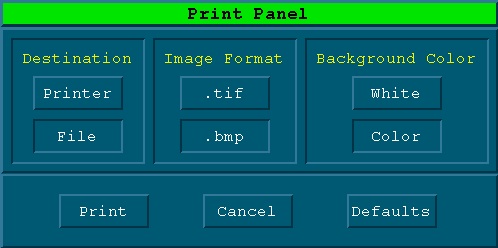
1. Click the "Zygo" button on the upper left corner of the application.
2. The "Print Panel" dialog box appears.
3. Choose File, .bmp, Color from the Print Panel then click Print.
4. Save the file with a .bmp extension.
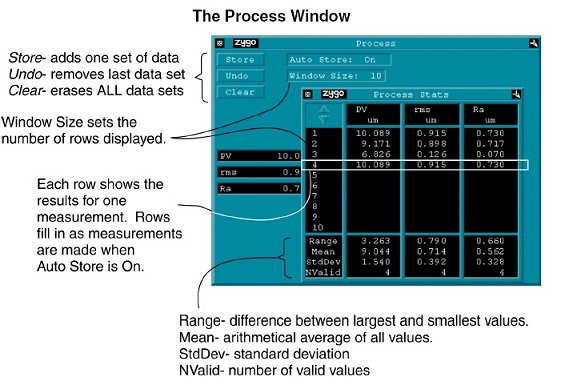
1. Click the process icon to open the process window.
2. To save a series of data as a txt or csv file, press the "zygo" button and choose to print to a file.
1. Ensure that the objective lenses are moved up to the limit or home position.
2. Press "Z-stop" on the joystick, so that the microscope does not go down.
3. Close the "MetroPro" software.
4. Log-out on the ISIS scheduler.
